We have a brand new implementation in d3.js of our structural-balance-viz algorithm designed to visualize structural balance in signed networks. It is available on github.
People involved: Francesco Bonchi, Edoardo Galimberti, Chiara Madeddu, Raluca Andreea Bibire, Giancarlo Ruffo
Original paper published in Proc. of Complex Networks 2019:
Galimberti E., Madeddu C., Bonchi F., Ruffo G. (2020) Visualizing Structural Balance in Signed Networks. In: Cherifi H., Gaito S., Mendes J., Moro E., Rocha L. (eds) Complex Networks and Their Applications VIII. COMPLEX NETWORKS 2019. Studies in Computational Intelligence, vol 882. Springer, Cham
https://doi.org/10.1007/978-3-030-36683-4_5
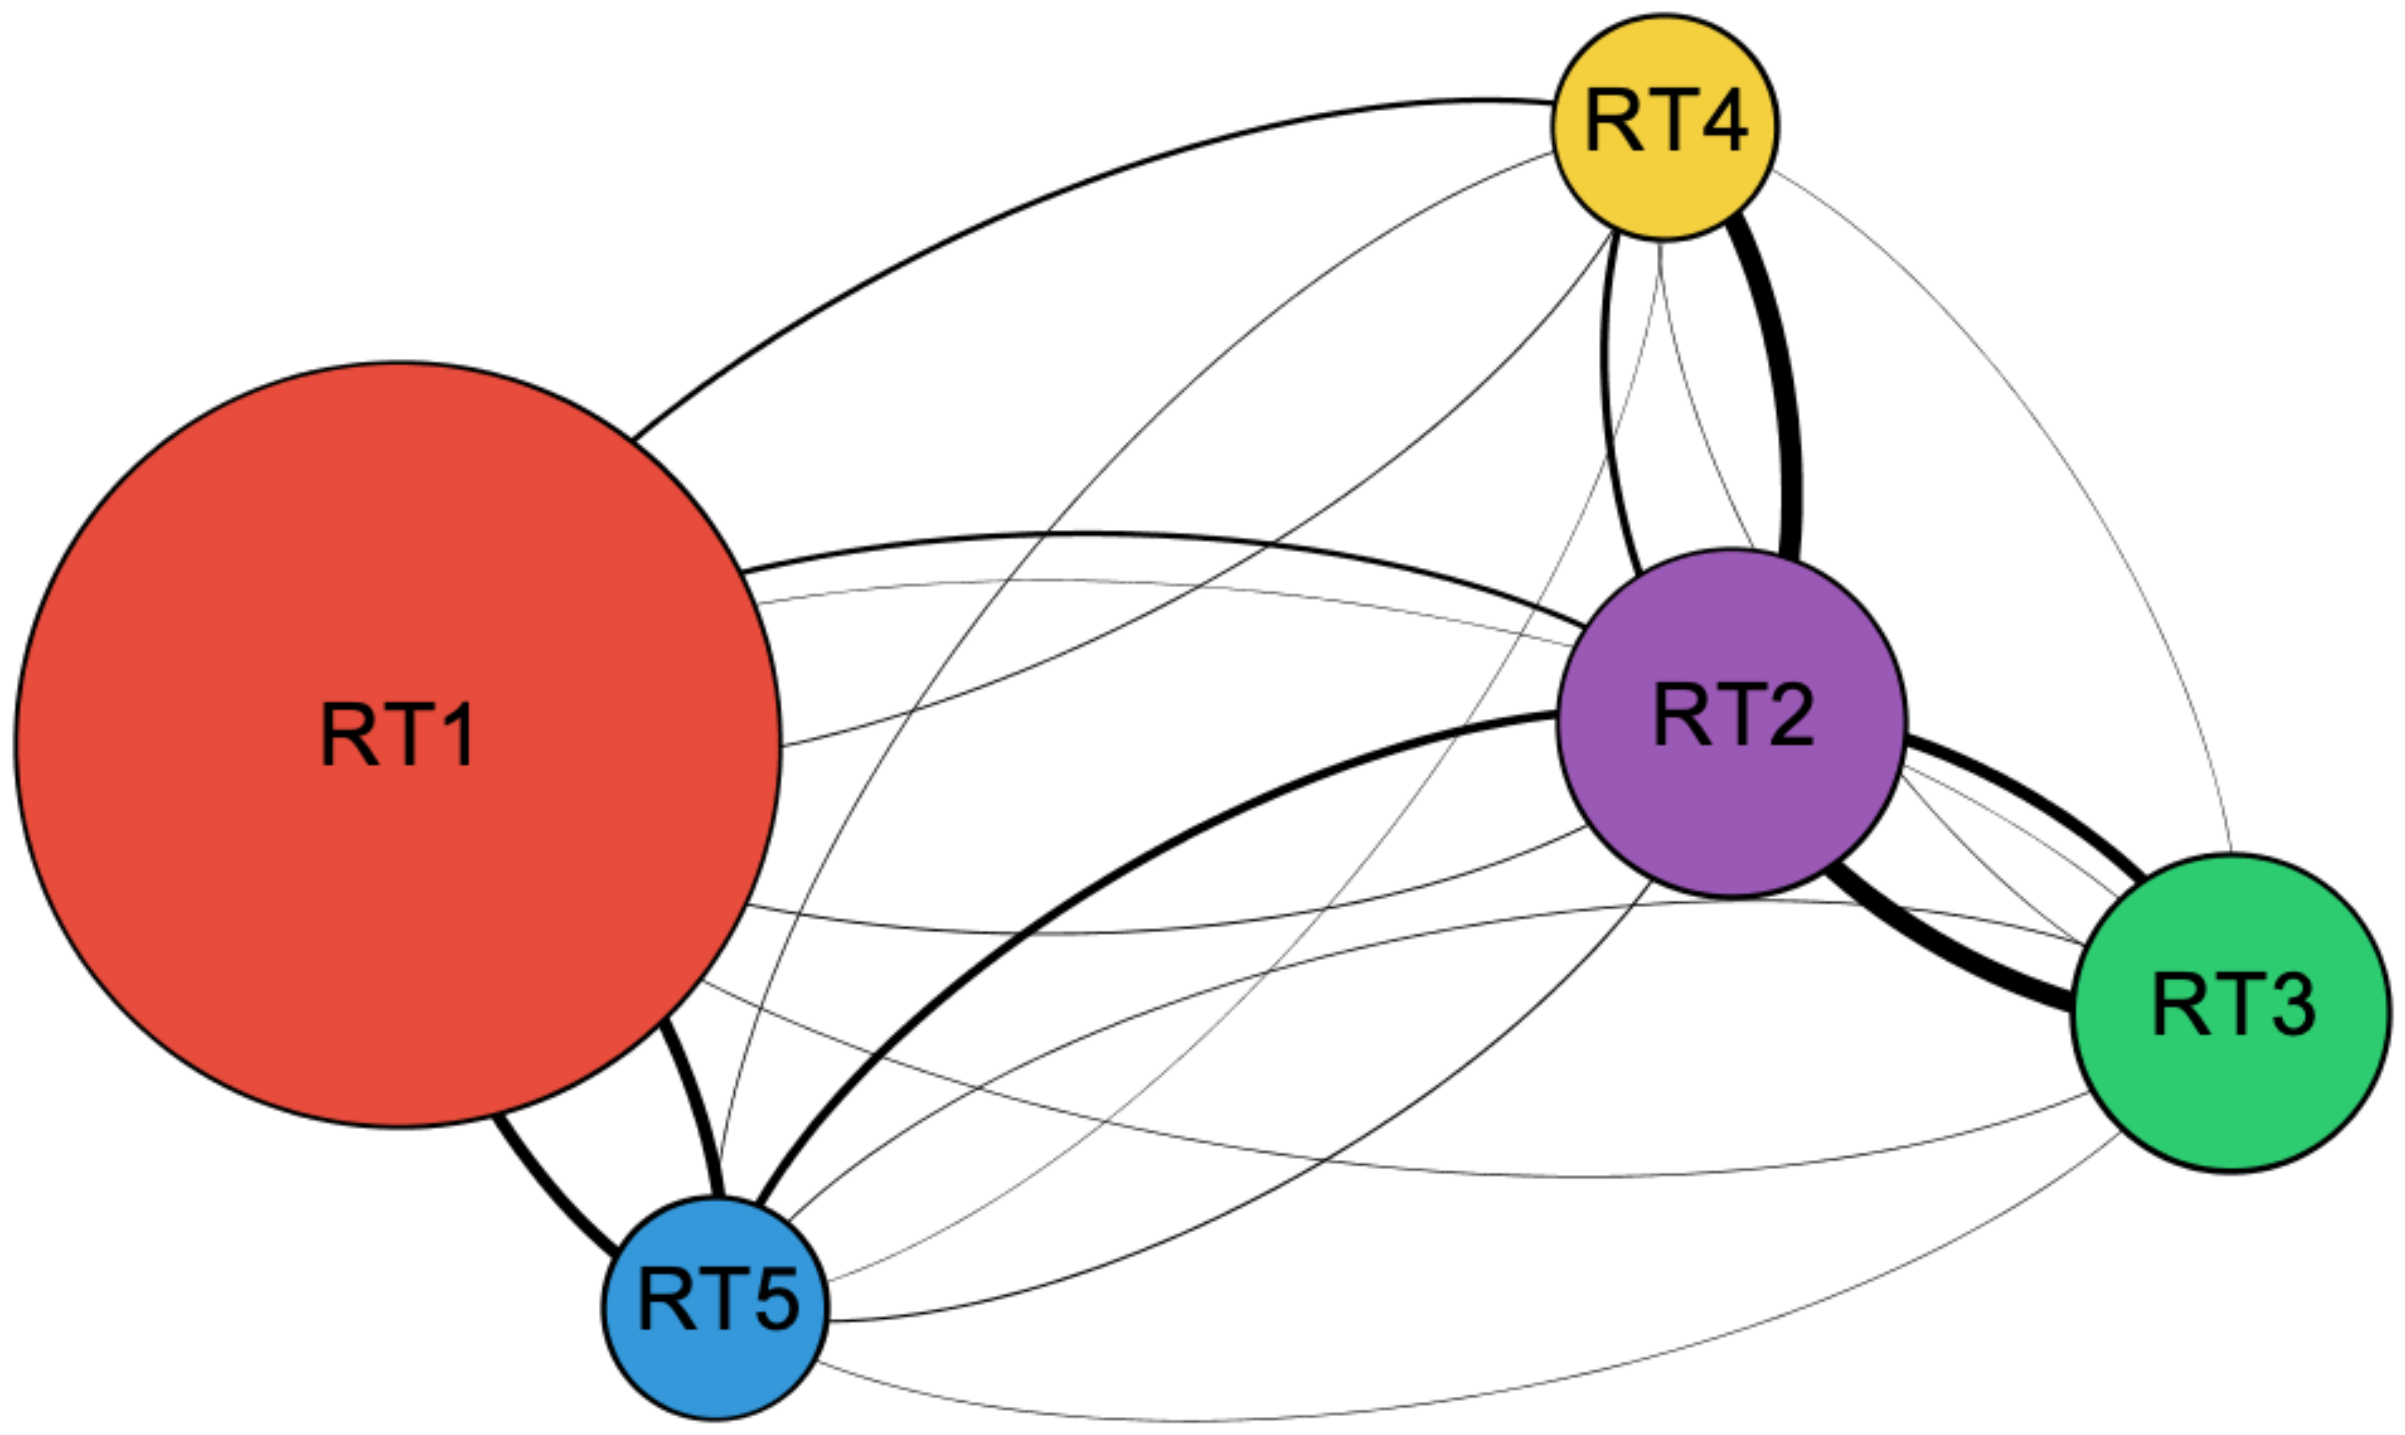
Network visualization has established as a key complement to network analysis since the large variety of existing network layouts are able to graphically highlight different properties of networks. How- ever, signed networks, i.e., networks whose edges are labeled as friendly (positive) or antagonistic (negative), are target of few of such layouts and none, to our knowledge, is able to show structural balance, i.e., the tendency of cycles towards including an even number of negative edges, which is a well-known theory for studying friction and polarization.
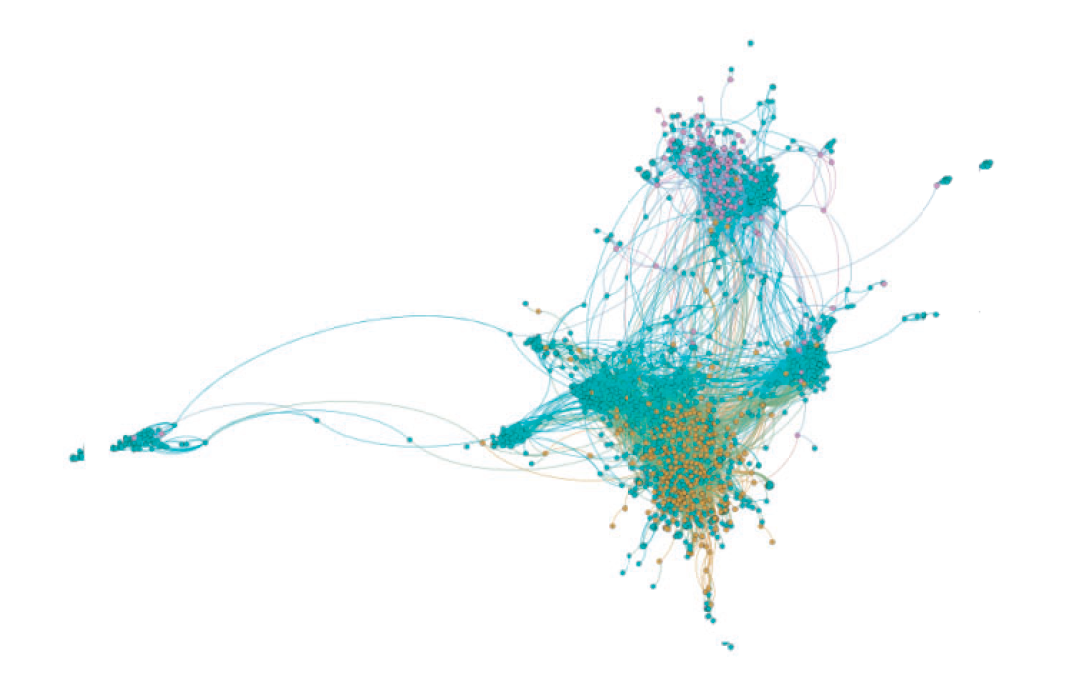
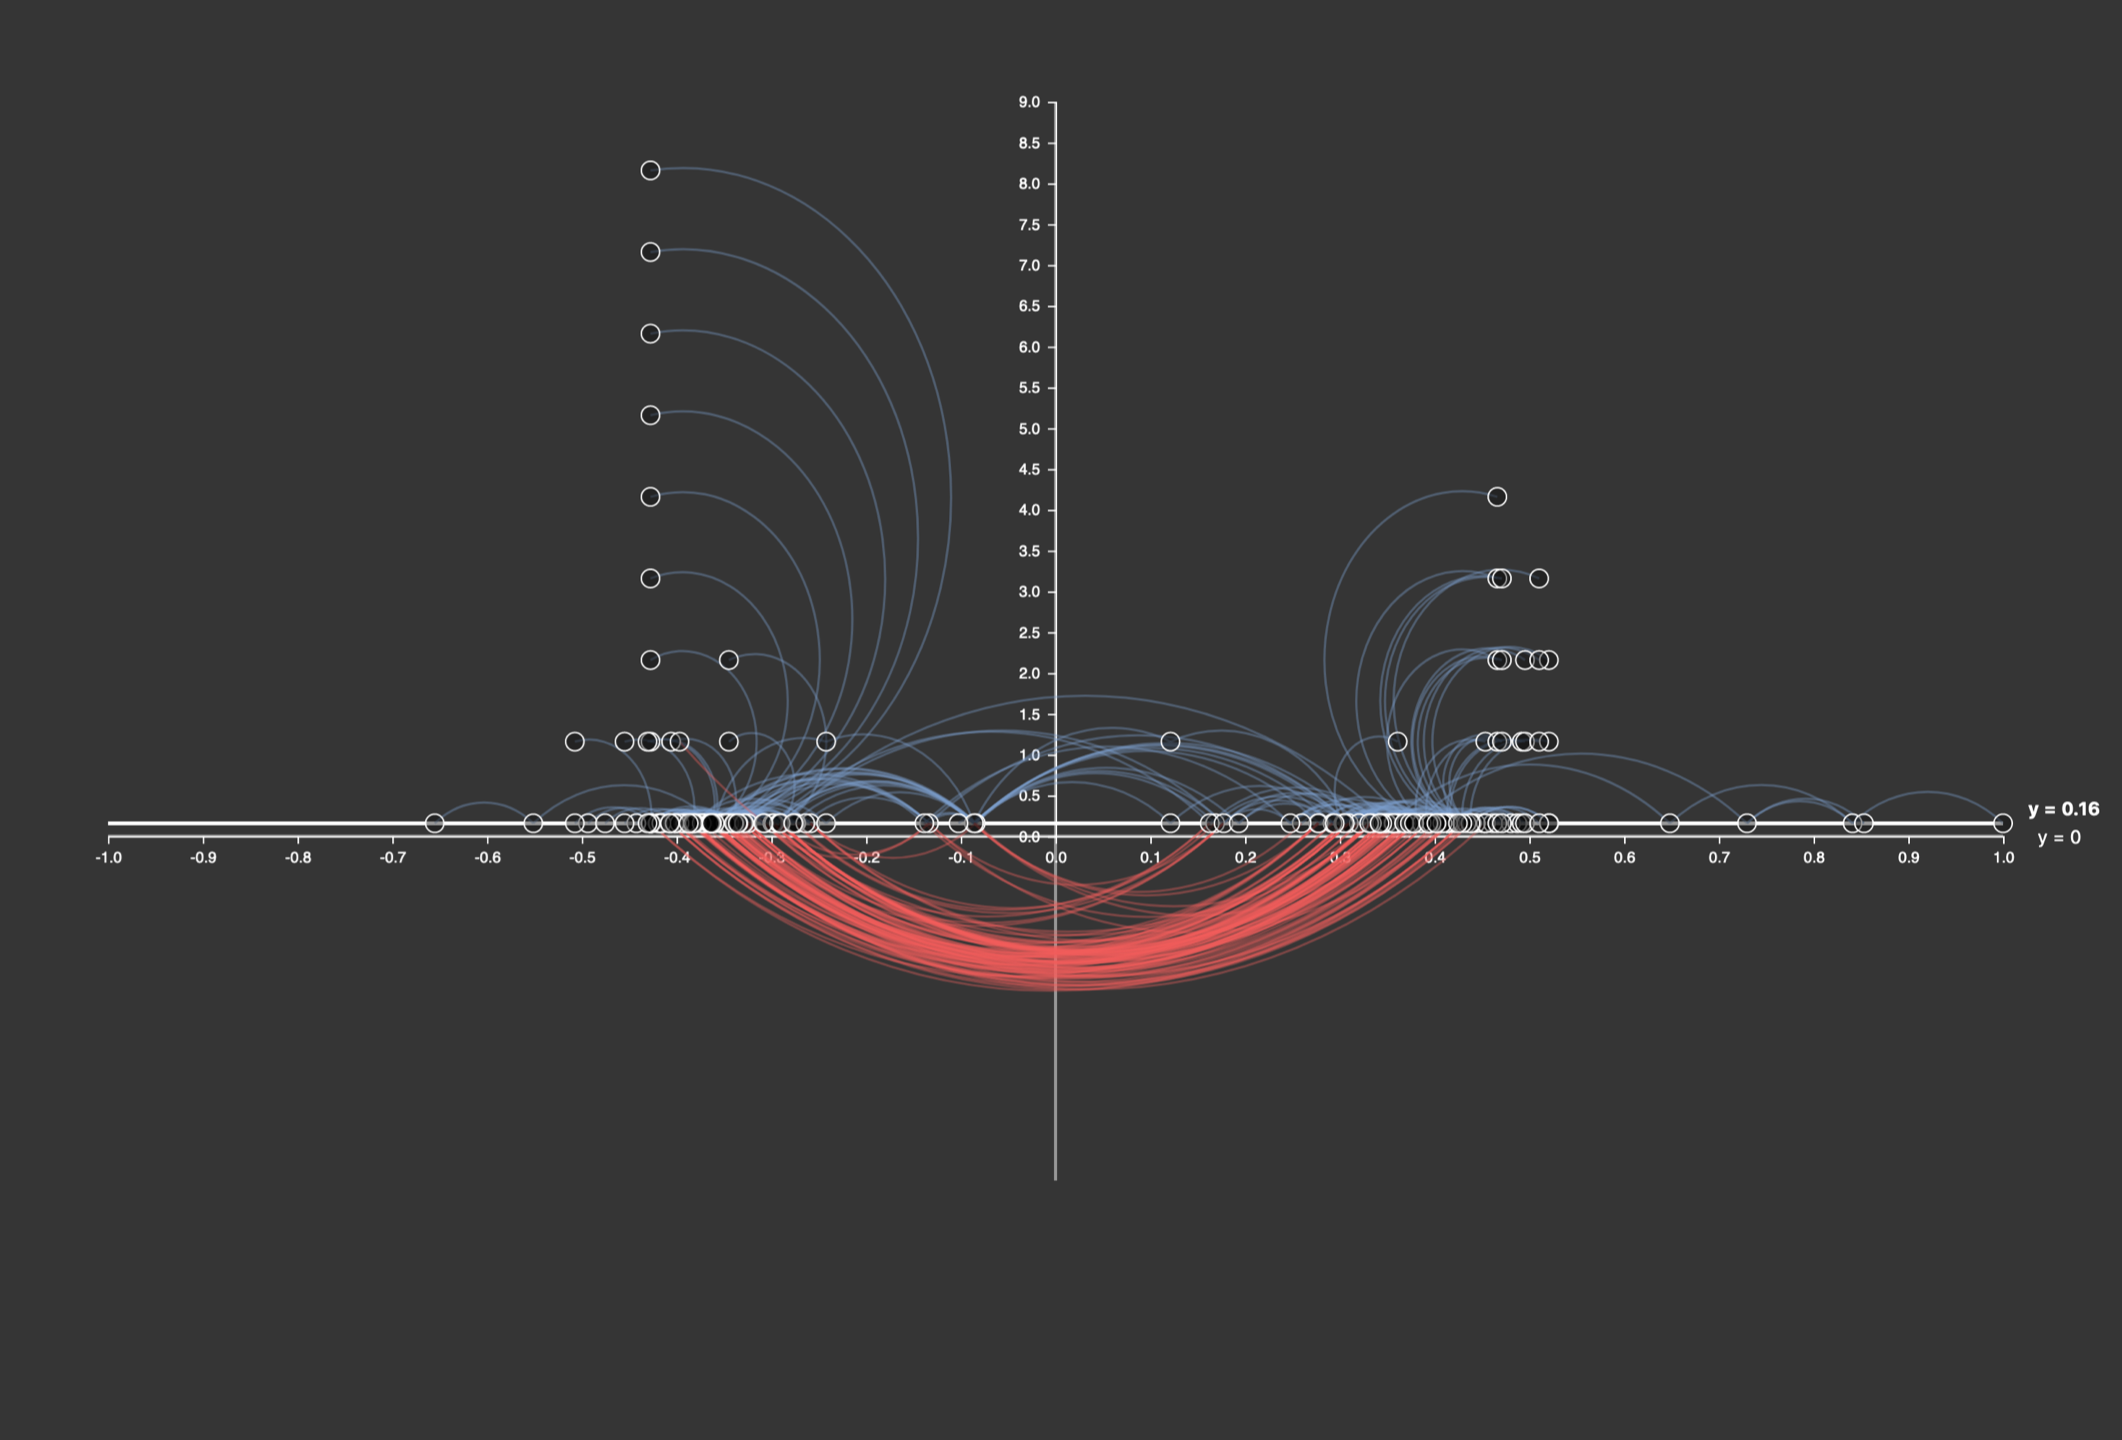
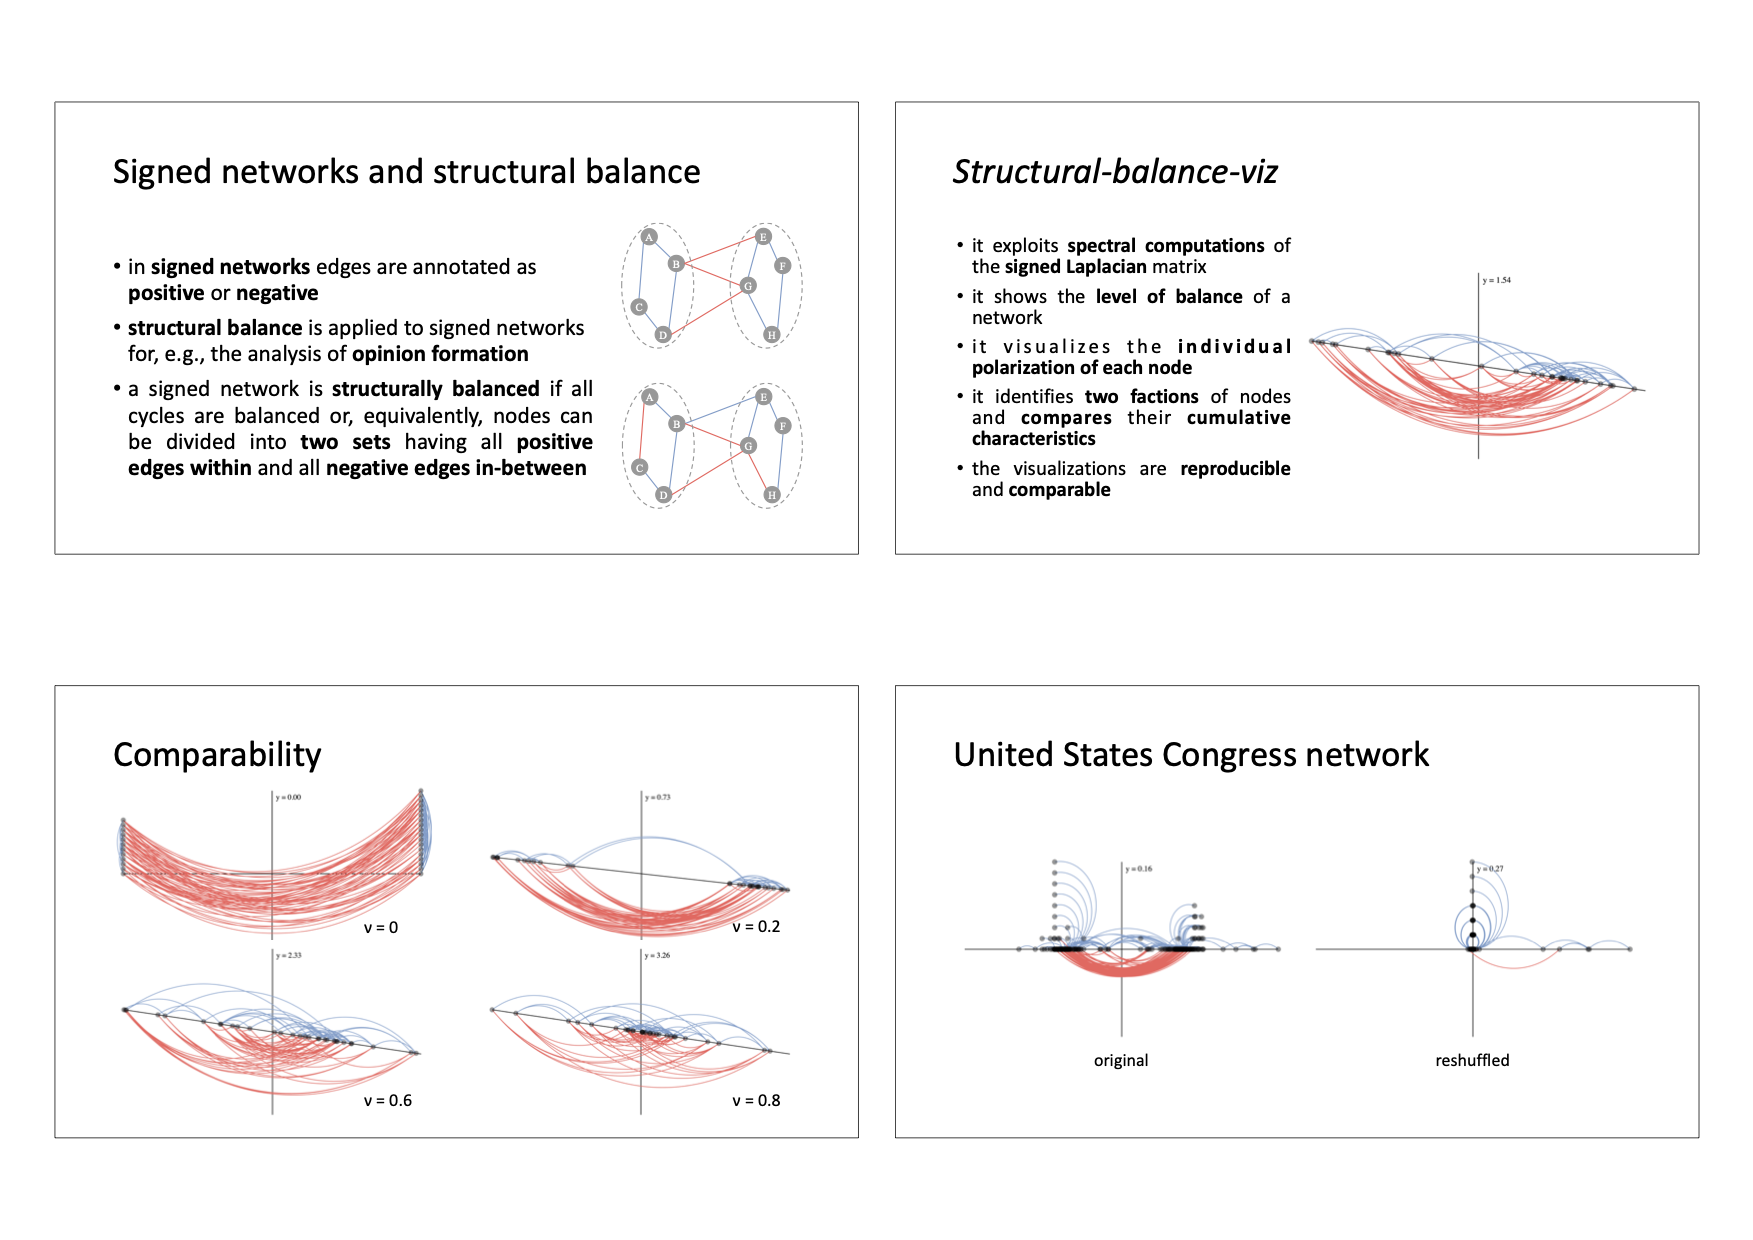
In this work we present Structural-balance-viz: a novel visualization method showing whether a connected signed network is balanced or not and, in the latter case, how close the network is to be balanced. Structural- balance-viz exploits spectral computations of the signed Laplacian matrix to place network’s nodes in a Cartesian coordinate system resembling a balance (a scale). Moreover, it uses edge coloring and bundling to distinguish positive and negative interactions. The proposed visualiza- tion method has characteristics desirable in a variety of network anal- ysis tasks: Structural-balance-viz is able to provide indications of bal- ance/polarization of the whole network and of each node, to identify two factions of nodes on the basis of their polarization, and to show their cumulative characteristics. Moreover, the layout is reproducible and easy to compare. Structural-balance-viz is validated over synthetic-generated networks and applied to a real-world dataset about political debates con- firming that it is able to provide meaningful interpretations.